Local Debugging
The first step in getting your function working is debugging it locally. SAM CLI supports the Delve debugger for Go, giving you access to a first-class debugger with step-through, watch expressions, and more.
Configuring Delve
Preparing your SAM app for debugging with Delve requires four steps:
- downloading Delve
- building Delve for amd64 linux
- making a debug build of your SAM app
- configuring your editor to connect to the debug server
Downloading Delve
To download Delve, copy and paste the following text in a terminal window:
go get -u github.com/go-delve/delve/cmd/dlvBuilding Delve
Building Delve requires that you build for the linux amd64 runtime, just as you do with your AWS Lambda functions. The command is similar:
GOOS=linux GOARCH=amd64 go build -o ./dlv github.com/go-delve/delve/cmd/dlvThis creates a Linux executable dlv in the root folder of your SAM application, e.g., sam-app.
Making a debug build
In order to debug your code, you must instruct the compiler not to perform certain operations that it normally would. You do this by passing the argument -gcflags "all=-N -l", giving the following command:
GOOS=linux GOARCH=amd64 go build -gcflags "all=-N -l" -o hello-world/hello-world ./hello-worldYou can combine this command and the Delve build command into a single section in your Makefile, such as debug. An example Makefile is provided below.
Configuring your editor
In Visual Studio Code, choose the menu item “Debug -> Open Configurations” and paste the following text:
{
    "version": "0.2.0",
    "configurations": [
        {
            "name": "Connect to SAM local",
            "type": "go",
            "request": "attach",
            "mode": "remote",
            "remotePath": "",
            "port": 5986,
            "host": "127.0.0.1"
        }
    ]
}
You can now use the Visual Studio Code editor to set breakpoints and add expressions to the watchlist.
- To debug your function, click to the left of the line numbers on line 29. A red circle will appear indicating that a breakpoint has been set.
- You can also select the line where you wish to set a breakpoint and choose “Debug -> Toggle Breakpoint” from the Visual Studio Code menu.
You should be able to use the above settings to configure any other debugger client, but this is beyond the scope of this workshop.
Step-through debugging
Now that you've configured your app and editor for debugging and set a breakpoint, you need to step through debugging to discover why your function isn't working. Each time you wish to debug, you must:
- Invoke the debugger
- Connect to the debugger
- Debug your code
Invoking the debugger
To invoke the debugger, you must pass the --debugger-path and optionally the --debug-port and --debug-args arguments to sam local invoke on the command line:
sam local invoke HelloWorldFunction \
  --debug-port 5986 \
  --debugger-path . \
  --debug-args "-delveAPI=2" \
  --event events/api-gateway-proxy-request.json
Connect to the debugger
In Visual Studio Code, navigate to the Debugger tab (1) and choose the play icon (2) to begin execution of your function. Execution will stop when it hits the breakpoint you set previously (3).
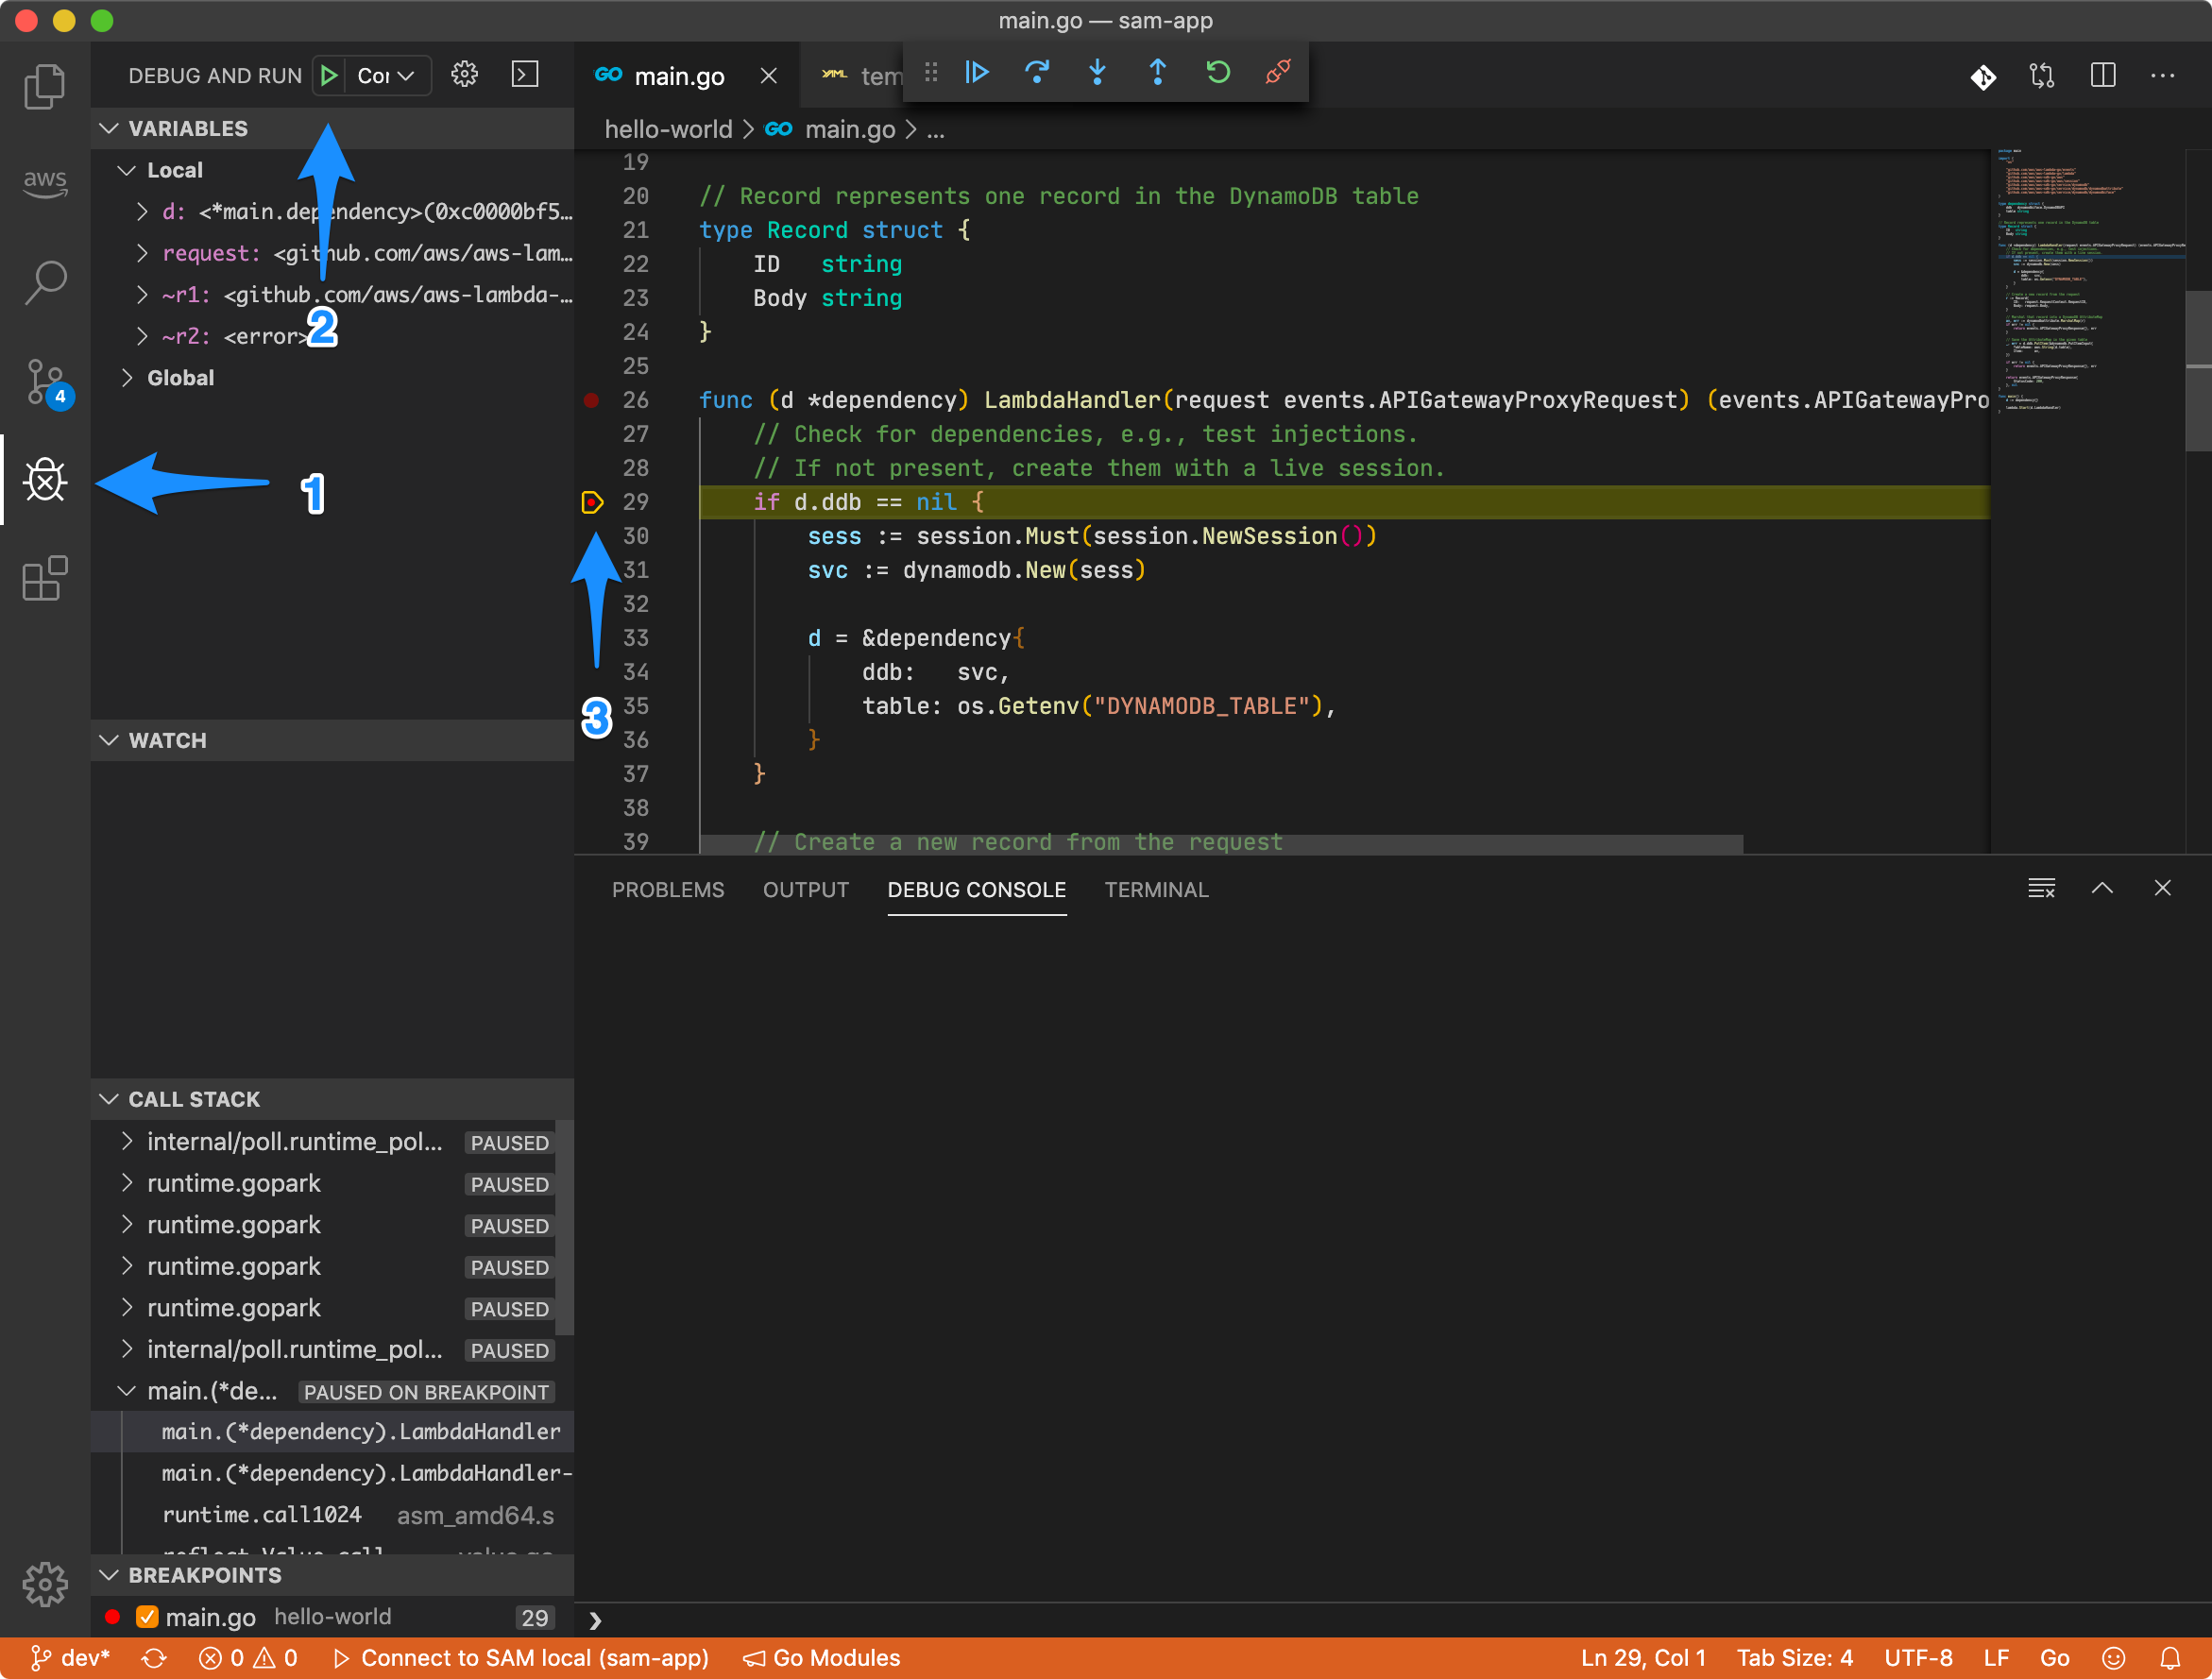
Visual Studio Code debugger
Debug your code
Choose the “step over” icon (1) to walk through each line of the initialization section of your function, paying close attention to the values of your dependency object.
After completing initialization, you will see that the value of d.table (2) is “VoteTable” - not “votes” as expected. You've found your first clue!
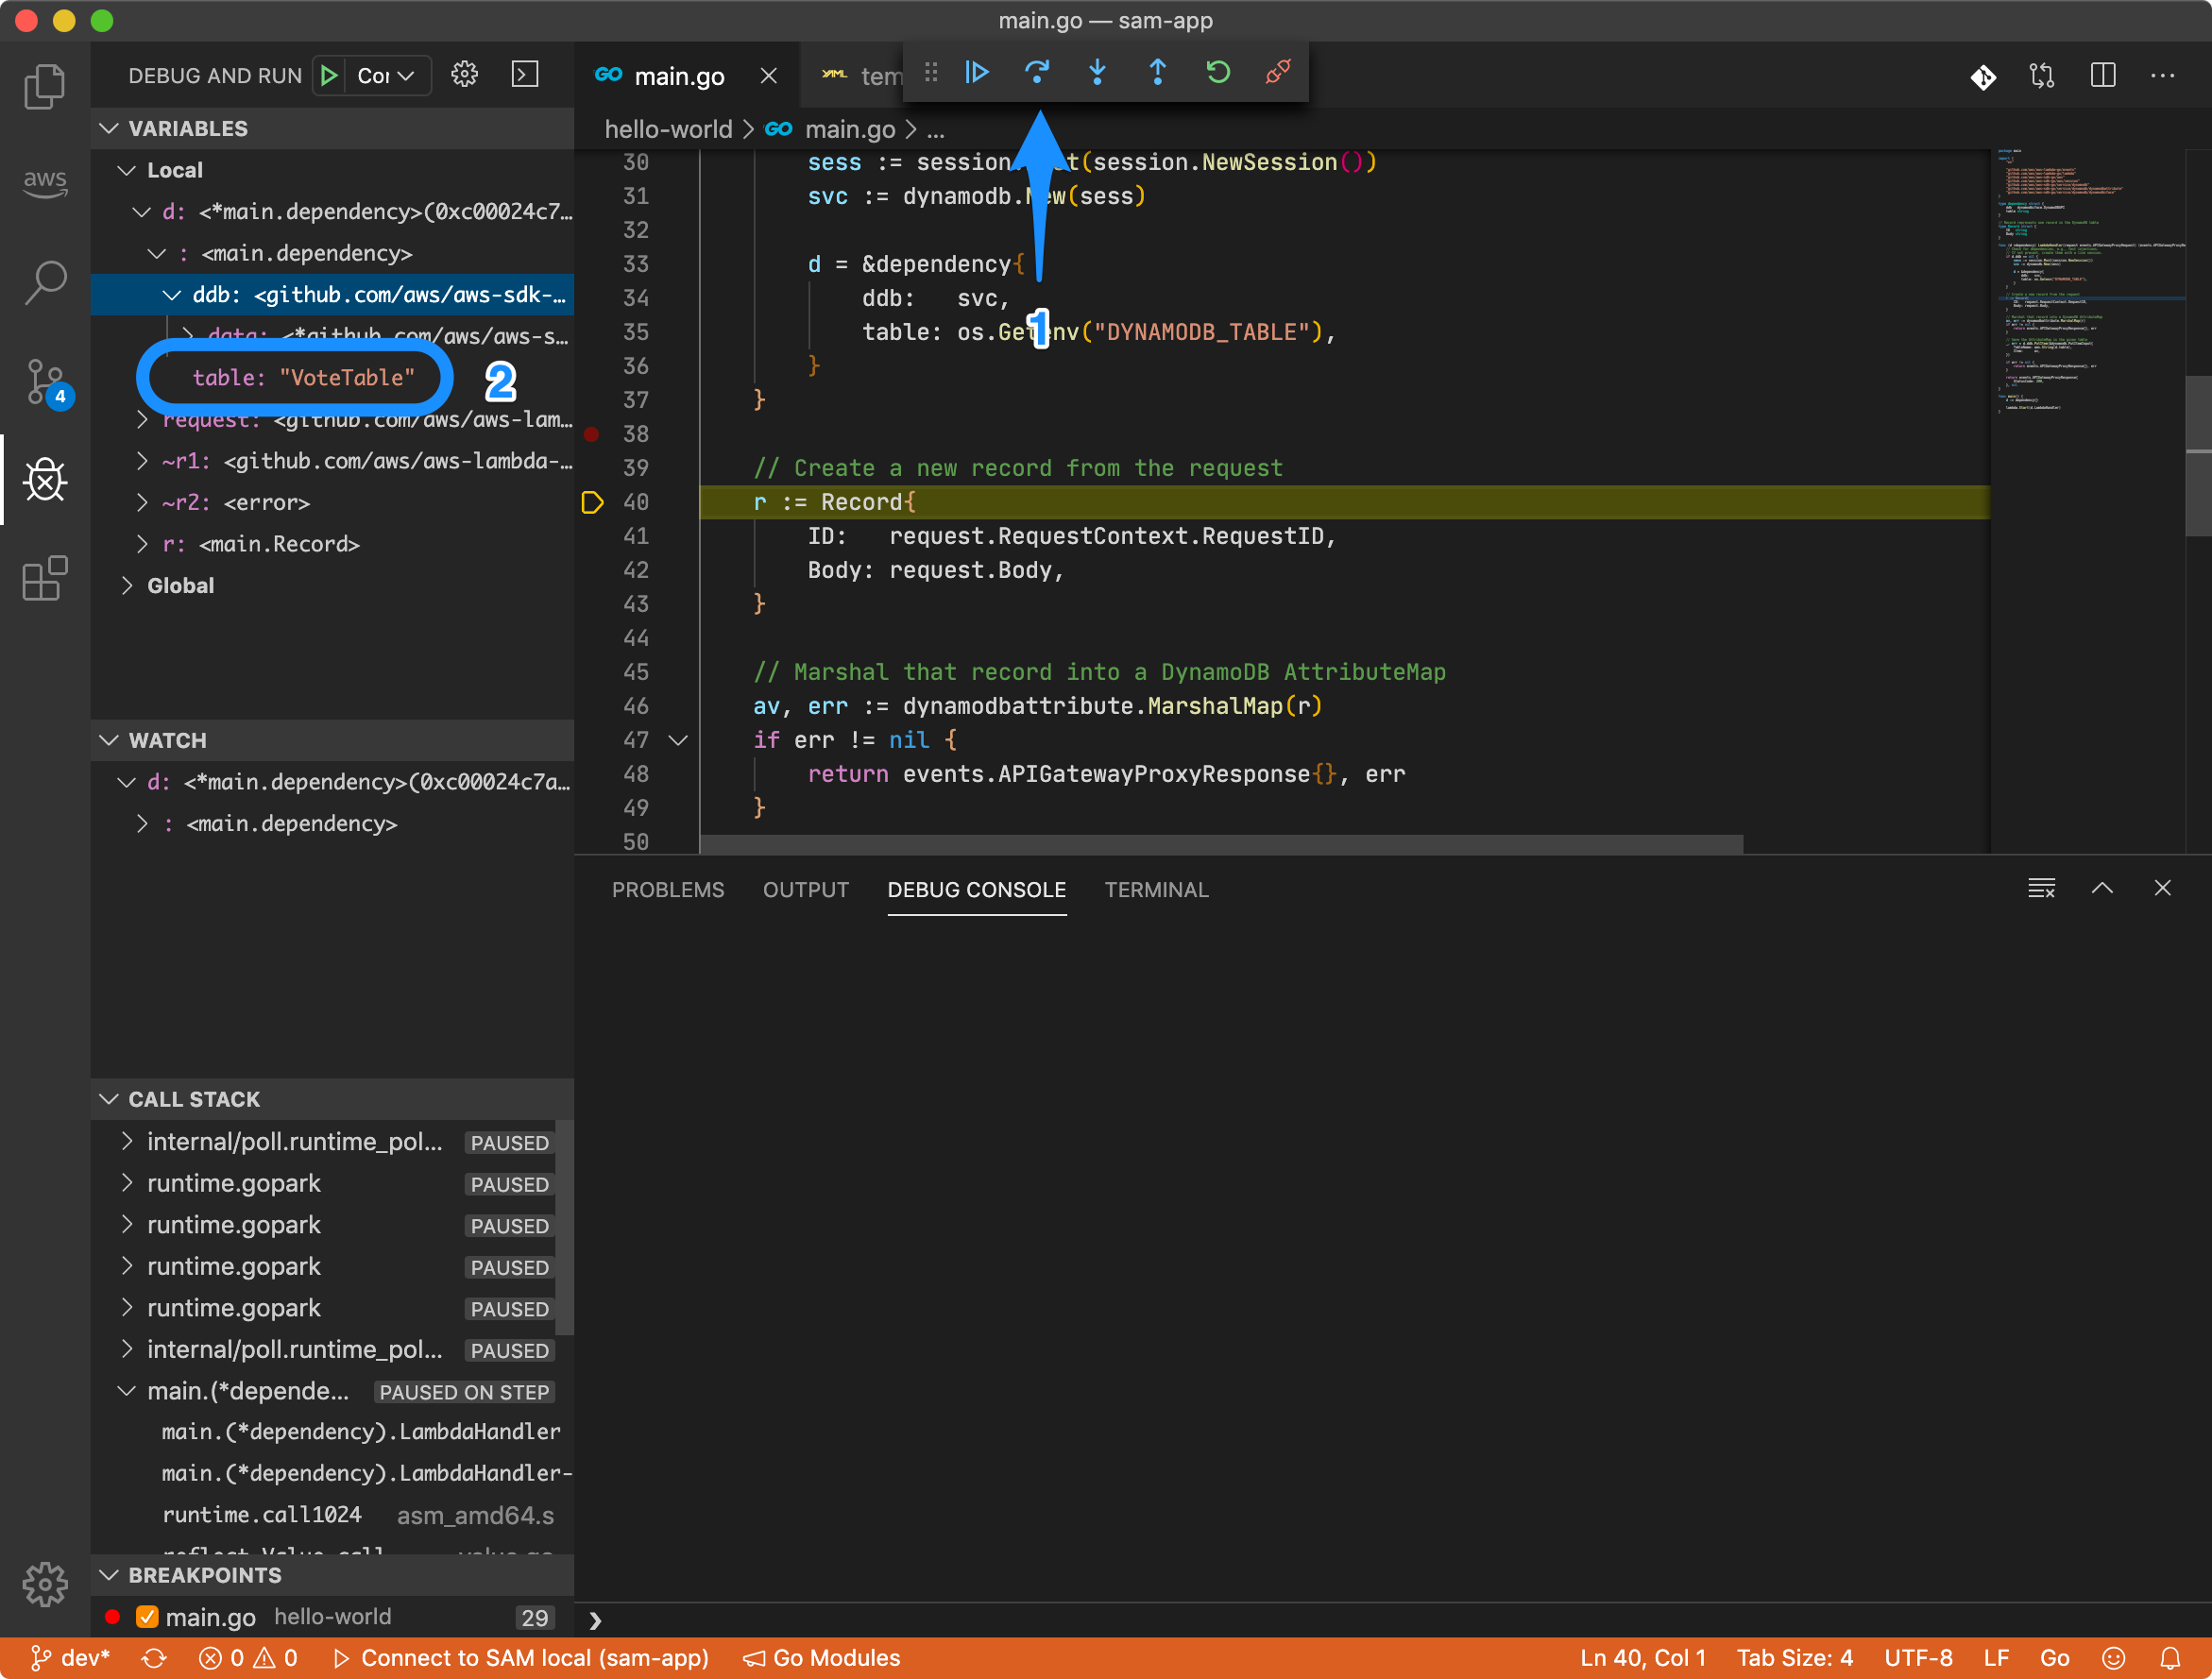
Something isn't right...
SAM local
The environment variable DYNAMODB_TABLE is set to reference the name of the VotesTable we create in our SAM template. However, this is a remote variable that is evaluated and expanded by AWS CloudFormation as it processes the template.
When you run sam local you must pass it a local representation of the environment variables it needs. You do this via the --env-vars or -n flag.
locals.json
Create a file locals.json and paste the following text:
{
    "HelloWorldFunction": {
        "DYNAMODB_TABLE": "votes"
    }
}
Now you can invoke your function as follows:
sam local invoke HelloWorldFunction \
  --event events/api-gateway-proxy-request.json \
  --env-vars locals.json
Or, to invoke your function for debugging:
sam local invoke HelloWorldFunction \
  --debug-port 5986 \
  --debugger-path . \
  --debug-args "-delveAPI=2" \
  --event events/api-gateway-proxy-request.json \
  --env-vars locals.json
API Gateway local
In addition to running your function locally for single invocations, SAM CLI can also start a local version of Amazon API Gateway with the sam local start-api command, enabling you to submit multiple requests to your function via the API endpoint:
sam local start-api \
  --debug-port 5986 \
  --debugger-path . \
  --debug-args "-delveAPI=2" \
  --env-vars locals.json
Notice that you can also invoke the debugger and take advantage of local environment variables while using sam local start-api.
You do not need to specify an event when starting the local API; the mocked API Gateway creates an APIGatewayProxyRequest event from your HTTP request and uses that event to invoke your function.
Additional resources
See debugging what you build for additional information on debugging your Go applications with Delve.